
Metrics and the math beneath
The software development market is growing at a CAGR of over 4%. Employment opportunities for software developers are expected to grow by 21% between 2018 to 2028. The above-given data suggest that software developed new market has got no stopping to ultimate growth and multi-billion contributions to different economies and cash flows around the world. What has more value is that over 57% of IT companies are planning to focus more on software development. The development stage of those projects takes around 63% of the software development budget issued for the project. This makes it imperative, and one doesn't need an Einstein's mind to understand that there is no way out but to compulsorily monitor Key software development KPIs and matrix for level up on your projects at scale.
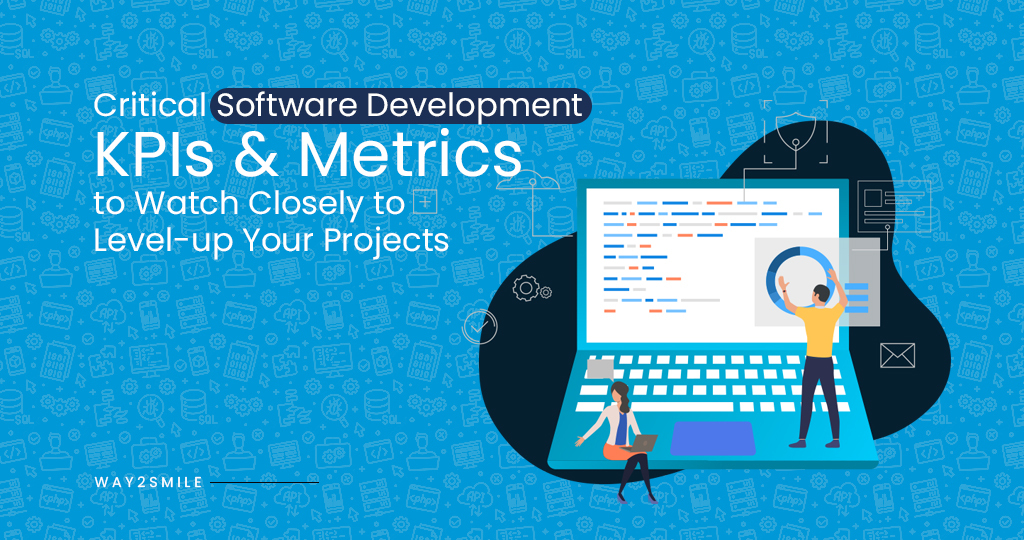
Top metrics to watch
Team Velocity
Team velocity is measured as the amount of work done or the task accomplished, including the number of story points delivered in a single sprint. Teams print as a key performance indicator only relevant when a preplanned set number of springs are to be performed; otherwise, it can be misleading to project managers instinctively extrapolating the amount of work done in the near future. One of the major benefits of using team velocity as a KPI is to force near future sprints and plan them with great forecasting.
Lead time
Lead time is one of the most critical key performance indicators and software development projects because it lets you keep track of the amount of time spent after receiving the requirements of a certain task and delivering back satisfactorily. It is also referred to as cycle time and is very helpful in getting a hand over the agility of a team. Lead time is a KPI that is always pressed upon for quicker development and overall deliveries.
Another great benefit of continuously tracking lead time is that it helps visualize data. It shows the process and the minute tasks that constitute the overall project and thus help you save the project from all possible situations and actions which may undermine the project. Lead time in cycle time is a simple matrix of time taken to complete the task. They often help project managers get a precise idea about the skill gap or the inefficiency if they can correctly gauge the complexity of those tasks. For example, suppose a team takes a certain amount of time to complete a very complicated task which is considerably different from the standard time taken to complete the job.
In that case, project managers can know that if the team is cutting down the lead time significantly, they are more than capable of completing this project within time and saving the time material cost for the business. On the other hand, if it takes an abnormally more time to complete the task, It should be an alarming situation to plug the skill gap or the efficiency bridge to clearly ensure the timelines are met without increasing the overall project cost.
Learn more: Top features that a Good Event Management Software must have
Sprint Burndown
Sprint burndown is doubly the most critical and nearest to a complete KPI for giving you an overall picture of the project at all times. Unlike most other KPIs which you may come across or use, this one can be a logical basis to many of them, and others might be derived due to one aspect of the other of sprint burn down. However, fundamentally, Street burndown is nothing more than the metric that is allowed to determine what exactly was accomplished during a specific sprint. Quantifying Spring burndown as a KPI, one must understand that it is a simple 2-D graph with a horizontal and vertical axis.
The horizontal or the independent X-axis contains time, and the Y-axis has the ratio of completed tasks by pending tasks. Therefore, the mathematical competition and definition of the respective KPI mix is critical and gives it the ability to provide a complete picture to all business owners, customers, and different stakeholders of software development projects at all points in time.
Code stability, Code churn
Code Stability is the measure of difficulty often defined in numerical's stating how much are the chances that slightest of the changes to the court can sabotage the production or potentially harm a business or software. Often Some senior developers who are conscious about quality chart the frequency of changes to the court and then wish to analyze its stability considering the differences and widespread outages caused by downtime to the business or software.
Call John's is another dimension to measure the stability of a code, but this refers to how often code changes over time. This is also capable of helping project managers and business owners analyze that to what extent the developers have to rewrite the code to accommodate new features and how difficult it is to augment different features from our bottom-up approach, building upon the software with time. If there is a lot of rewriting and re-working to be done every time, this means that the project or the overall business idea has a high maintenance cost involving risk at times.
MTTR/ MTBF
Meantime to repair is a highly critical KPI because it directly involves user experience in the process. By definition, mean time to repair is the total amount of time from the moment or service was considered down or defective two the time it was again available for full fledge its use on merit by the customer. This might sound similar to lead time, but it is critically different because it directly involves the end-user. The overall experience depends on how low MTTR can be for a project already in production.
MTBF or mean time between failers, is one of the most famous and progressively used KPI for measuring the efficiency or success rate of a development team. The overall time this needs should be as large as possible because a unit of time will have smaller failures if the mean time between two failures increases to its utmost potential. This makes the overall software leaner and minute to use and gives a more professional user experience for an everlasting impression on the end user's mind.
Learn more: 6-Step Approach for Successful Enterprise Software Development
New age CEOs approach
It is easy to come across dozens and dozens of KPIs that are either partially or completely overlapping in nature, have similar mathematical competition, and probably give the same side of the story over and over again for any software development project in today's time. Being on top of the situation with your project and knowing what it takes to build a valuable IT consulting company is all about focusing on only what matters without any redundancy. Being on top of the data arrays and collecting the right data points will help track and analyze KPIs over some time. Still, that data needs to be clean just by the principal your machine learning models need to be highly lean with a definite objective.
With a similar approach, new eight CEOs are bringing in the trend of only analyzing 8 to 10 KPIs, each distinctly different from the other, having its own meaning and generating either forecasting or leading results depending upon what can be perceived in the project shortly and how the team has performed on business deliverables across time. Ultimate focus on KPIs can commonly lead project managers and business owners to stray from the core business objectives. Remember that software development ideas and technology businesses succeed in making sense out of KPIs and not the other way round.
Conclusion
It is important to note that the most critical and easy to manage, maintain and analyze KPIs are discussed here, while dozens of non-tangible, clattering KPIs are ignored for the moment. We understand that aspects like maintainability, serviceability, replicability, and others are important to note. Still, one should know that managing the most relevant 8 to 10 KPS can take care of such situations and non-tangible attributes of performance without staggering focus from the quality and timely execution. Top IT consulting companies are rigorously reducing the amount of data collected in projects for better atomic-sized Cingular analytics and insights about their own performance and satisfaction in 2022.